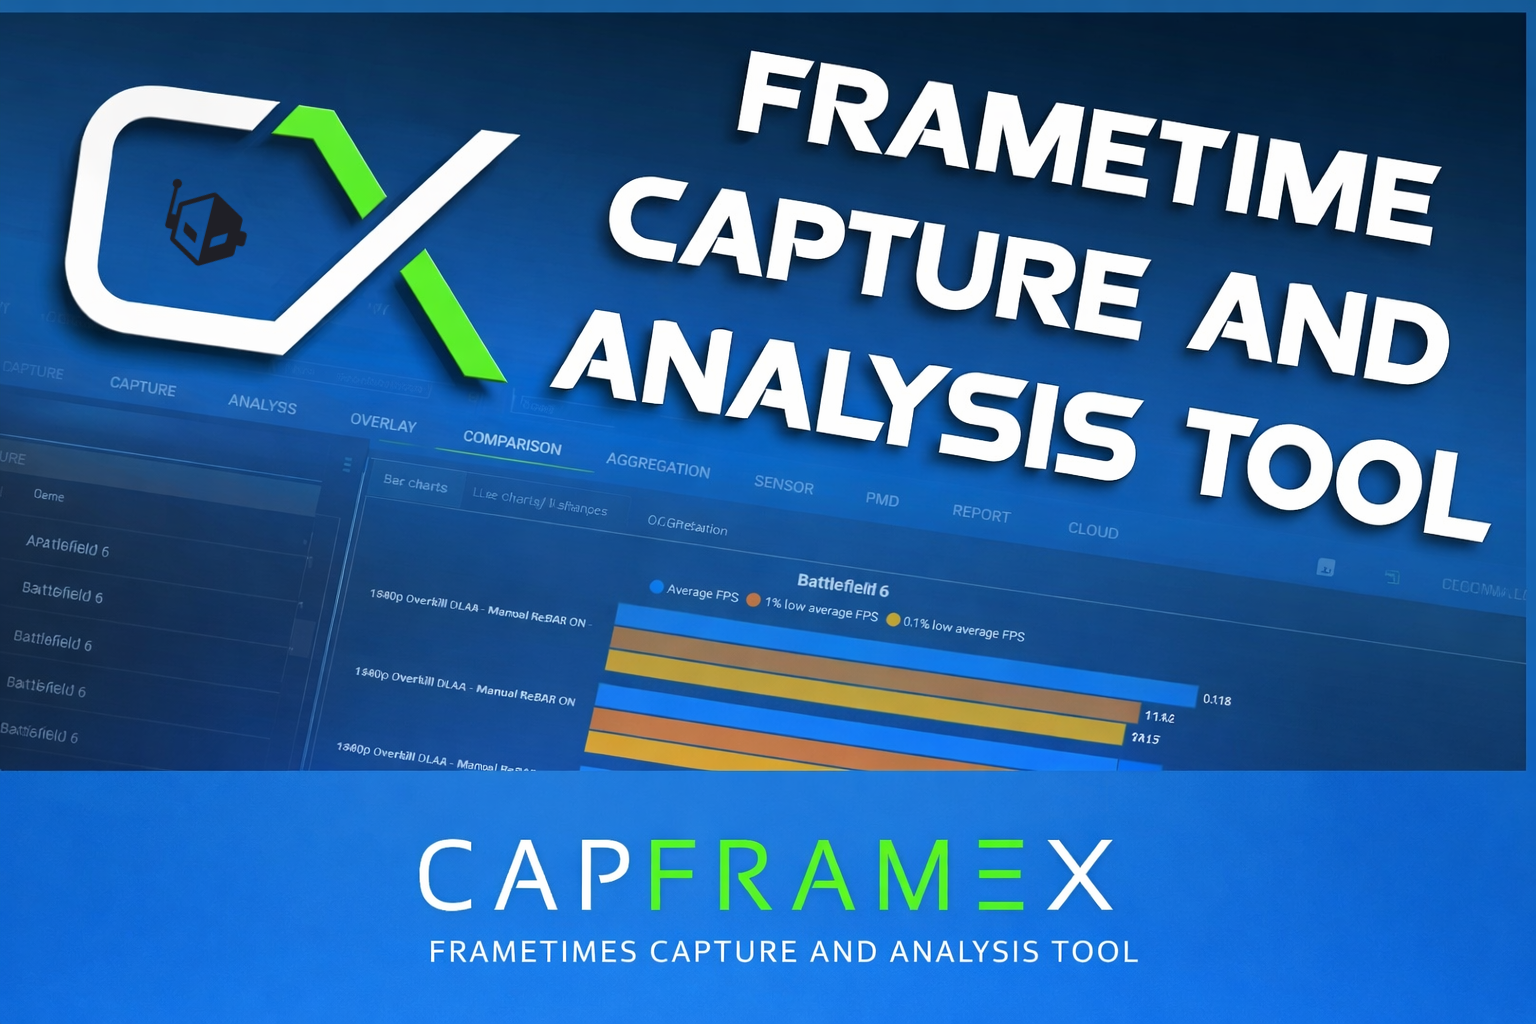
How to Properly Benchmark your PC Games Using CapFrameX
In the world of PC gaming performance, it’s easy to get fixated on a single number, “Average Frames Per Second (FPS)” as though it tells the whole story of how a game will feel in actual play. But anyone who’s seen a benchmark with a high average yet experienced jarring stutters and hitches knows that consistency matters just as much as raw framerate. That’s where proper benchmarking comes in: measuring not just average FPS but also the more telling 1% low average FPS and 0.1% low average FPS metrics, which reveal how often and how severely your system dips below peak performance during real gameplay. These metrics are essential for understanding a game’s smoothness and responsiveness, since they represent the average of the worst 1% and 0.1% of framerates.
CapFrameX has emerged as one of the most popular tools among PC gaming enthusiasts and reviewers alike for capturing and analyzing deeper performance data. Instead of relying on simple FPS counters, CapFrameX records raw frametimes and converts them into meaningful performance metrics that help you analyze, compare, and optimize your gaming experience with great precision. In this guide, we’ll walk you through how to set up CapFrameX properly, run consistent benchmarks, interpret the results, and present your findings in a way that actually reflects real-world performance and not just shallow numbers.
What CapFrameX Actually Measures
When you run a benchmark in CapFrameX, you’re not just looking at a single number; you’re capturing per-frame data and turning it into meaningful performance metrics that show how smooth and consistent a game feels, not just how fast it runs. Under the hood, CapFrameX records frametimes, the duration it takes to render each individual frame, and then converts those into traditional framerates. Frametimes and framerates are inversely related (FPS = 1000 / frametime or frametime = 1000 / FPS, with frametimes expressed in milliseconds or ms for short), meaning lower frametimes correspond to higher framerates and vice versa. These raw data are far more accurate for performance analysis than simple overlay FPS counters, which can hide potential stutters and hitches.
From those frametimes, CapFrameX generates many different key metrics that reveal different aspects of performance, and in this article, we will focus on the following three metrics that are recommended by CapFrameX developers to measure gaming performance:
- Average FPS: This is the standard overall framerate averaged across your capture session. It’s useful as a headline number, but alone it doesn’t really tell you how stable the experience feels during actual gameplay.
- 1% low average FPS: Represents the average worst 1% of framerates. This gives a much more representative picture of the worst sustained performance, letting you see how often your framerate dips during demanding moments. A high 1% low average FPS (relative to the average FPS) usually indicates a smoother and more consistent experience.
- 0.1% low average FPS: Represents the average worst 0.1% of framerates. This metric reflects the performance you rarely drop below, the absolute bottom of the performance curve that’s most likely to cause perceptible stutters or hitches. This metric is especially useful for highlighting rare but severe dips that may not show up in averages.
CapFrameX’s use of these percentile-based metrics, which are derived from actual frametime sorting and conversion, is why many individuals in the PC gaming community prefer it. It gives you both speed (average FPS) and smoothness (1% and 0.1% low average FPS), so you can judge gaming performance comprehensively rather than rely on simple FPS counters.
Preparing Your System for Benchmarking
Benchmarking isn’t just about running a tool and writing down numbers. Your system needs to be consistent and controlled so the results you gather reflect real performance and aren’t skewed by background apps, thermal throttling, or unstable drivers. The following are the essential steps you should take before capturing any benchmark runs.
Updating your UEFI BIOS, operating system, and drivers
Before attempting any benchmark runs with CapFrameX, make sure that your motherboard’s UEFI BIOS, operating system, and drivers are all fully up-to-date, as an out-of-date software environment can cause performance anomalies, instability, and inconsistent benchmark results, including erroneous frame timing. When it comes to graphics drivers, especially, cleanly uninstalling them with a tool like Wagnardsoft’s Display Driver Uninstaller before cleanly installing them can help a great deal with minimizing potential graphics driver-related issues.
Clearing the benchmarking environment
To minimize interference and resource contention:
- Close unnecessary applications and processes; web browsers, cloud sync apps (OneDrive, Dropbox), chat/voice apps like Discord or Slack, streaming/recording software like OBS, and any background utilities not needed during testing can consume valuable hardware resources.
- Disable overlays and recording features from tools like Discord, Steam, Xbox Game Bar, NVIDIA App, etc., as these can add overhead or interact with frame capture in unpredictable ways. The exception to this rule is the Rivatuner Statistics Server overlay, and we shall see why later.
- Temporarily pause antivirus scans or scheduled maintenance during benchmarking if you’re sure the benchmark software is trusted, as real-time scanning can slow down game load and execution.
- Make sure that V-Sync (Vertical Sync) is set to “OFF” in your given GPU vendor driver’s settings, or set to use the game’s settings, then have it disabled in them.
- Make sure that game rendering latency-lowering technologies like NVIDIA Reflex Low Latency, AMD Anti-Lag, and Intel Xe Low Latency are disabled, as these technologies can not only act as framerate limiters but also sacrifice frametime consistency to minimize game render/input latencies.
Configuring power and performance settings
Ensure your system isn’t throttling itself:
- In Windows Power Settings (accessible from Settings -> System -> Power & battery under Windows 11), switch to either High Performance or Balanced power plans so that your system runs with as few power throttling features as possible.
- If you’re on a laptop, plug in the power adapter and disable any battery-saving features, at least temporarily, during your benchmark runs.
- Set your GPU to run at its maximum performance profile from your GPU’s graphics driver software (exact instructions may vary by GPU vendor). This one is optional, but it is still recommended to ensure maximum consistency.
Monitoring temperatures and stability
Thermal throttling can skew benchmark numbers by reducing CPU/GPU clocks under load. Before benchmarking:
- Use hardware monitoring tools like MSI Afterburner or HWiNFO to ensure that your CPU/GPU temperatures remain in safe ranges and don’t spike abruptly under heavy gaming loads.
- If your system is unstable due to aggressive CPU/GPU overclocks, undervolts, or RAM tuning profiles, then strongly consider reverting to stock settings in order to produce stable baseline benchmark results.
Maximizing consistency
Run benchmarks under the exact same conditions every time:
- Use the exact same graphics settings for every capture.
- Avoid changes to system state (no background OS/driver/app updates or downloads kicking in mid-run). This can be achieved by temporarily disabling your internet connection during your benchmark runs.
- If possible, perform multiple benchmark runs (CapFrameX has a feature that streamlines this, which we shall see later) and average the data. This can greatly minimize run-to-run variance.
By taking these preparatory steps, you create a controlled environment where benchmark differences truly reflect changes in your system or game settings, not background tasks, throttling, or inconsistent system loads. Once your machine is prepped and stable, you’ll be in a much better position to capture meaningful performance data with CapFrameX.
Installing and Setting Up CapFrameX
Getting CapFrameX up and running is straightforward, but it helps to follow a clear setup process so that your captures are reliable and your results are meaningful. The following is a step-by-step walkthrough to help you install and configure CapFrameX properly.
1. Downloading CapFrameX
Head to the CapFrameX GitHub Releases page to grab the latest beta build (choose whether you want the installer or the portable version) from the Assets section:

Note that CapFrameX requires .NET Framework 9 or higher on Windows 10/11 to function properly.
2. Optional but recommended: Installing RTSS for displaying the performance metrics overlay
CapFrameX uses the open-source Intel PresentMon backend to capture frametimes, and to display performance data in-game, you’ll want to install the latest version of Rivatuner Statistics Server (RTSS), which you can grab from this link:
3. First-time launch and setup
Start CapFrameX:
When you first launch CapFrameX, it may create necessary configuration and benchmark capture folders. Let it open and then close it once to initialize this folder structure.

Capture folder setup:
Click on the vertically aligned Observed directory button on the middle far left of CapFrameX’s UI, then either note the default directory where your benchmark captures will be stored (in the form of JSON files), or change it to another directory of your choosing, should you so desire.

4. Setting up capture options
CapFrameX lets you control capture timings, delays, hotkeys, and even sound cues, which are all important options for properly setting up repeatable benchmarks. These options are:
- Capture hotkey: This option allows you to set a keyboard hotkey combination of up to three keys, including up to two modifier keys (CTRL, SHIFT, ALT), in order to start or stop your benchmark capture. This allows you to control exactly when CapFrameX begins (and ends) logging a benchmark run.
- Capture time [s]: You can leave this option at 0 for unlimited capture time (meaning you manually start and stop the capture yourself), or set a specific time (in seconds) for fixed-length runs.
- Capture delay [s]: This option allows you to either not delay the time the capture starts (when set to 0) or to delay it by setting it to a positive integer time value (in seconds) of your choosing.
- Hotkey sound: This option allows you to set a sound (either a human voice or a simple sound cue) or no sound cue at all to provide auditory feedback for your capture start and end times.

Now, you might recall that I mentioned early on in this guide that CapFrameX had a feature to streamline game benchmarking with multiple runs in order to minimize run-to-run variance. That composite feature is called Run history and aggregation. What follows are short explanations of what the two main components of this feature are and what their associated parameters do:
Run history: This refers to the internal buffer of recent captures that CapFrameX tracks during your benchmarking session, if the run history option is enabled. When you record multiple runs back-to-back (for example, 3 or 5 runs of the same benchmark scene), CapFrameX will store all of them in the run history so that you can display performance metrics for all of these runs individually, or aggregate them into a single, “summarized” run.
- Number of runs: This option sets how many consecutive benchmark captures make up a complete run history session before aggregation triggers (if aggregation is enabled).
- Reset run history: This option clears the currently stored run history by dropping all runs that have been stored so far.
- Second metric and Third metric: These options allow you to specify the two additional metrics that will be shown in the overlay or report display alongside your primary metric (which is usually Average FPS).
Aggregation of run history: Once your run history contains the set number of runs, this option combines them into one single record file containing the merged raw frametime data from all runs, displayed in the form of your three chosen performance metrics (as recommended in this article, these should usually be Average FPS, 1% low average FPS and 0.1% low average FPS). This feature is very useful because a single capture can be influenced by transient background tasks, while multiple aggregated runs give you more statistically meaningful data.
- Outlier handling: This controls how CapFrameX treats unusual runs that deviate significantly from the others in your run history. When aggregation is enabled, CapFrameX checks for outliers using both the median of a selected metric and a defined percentage threshold (for example, 3 %) to determine if a run is significantly different than the others.
- Save aggregated result only: When this is enabled, CapFrameX only saves the final aggregated record file (not each individual run). This keeps your capture directory cleaner if you’re only interested in the summary.
- Outlier metric: This selects which performance metric CapFrameX uses to detect outliers during aggregation (for example, one of Average FPS, 1% low average FPS, or 0.1% low average FPS). CapFrameX will then compute the median of the selected metric across all runs and see if any runs fall outside the set outlier threshold. Those runs may be flagged or rejected depending on your Outlier handling setting.
- Outlier percentage: This defines how far away a run’s selected metric needs to be from the median to be considered an outlier. Typically, this is a small percentage, like 3 %.
If these options sound a bit too complicated to grasp, then you can simply leave them at their default values. The most important thing is to know how to properly interpret the resulting benchmark results in your captures.

5. Testing whether your CapFrameX setup works
With CapFrameX and (optionally) RTSS installed and opened in the background:
- Run a quick capture:
Launch a game you want to benchmark. Once it’s running, use your capture hotkey to start logging and then stop it after a consistent segment of gameplay. - Verify the existence of the capture:
In CapFrameX’s Captures section in the Capture tab, your saved capture should appear. We shall see later how to display and properly analyze the various capture performance metrics. - Adjust your settings if needed:
If captures aren’t appearing correctly or the overlay doesn’t show up, revisit your hotkey settings.

6. Tips
- If you ever want to reset CapFrameX’s settings or overlay configuration profiles, you can delete its configuration folder under
%APPDATA%\CapFrameX\Configuration. - Keep CapFrameX updated by downloading any newer releases from the aforementioned GitHub Releases page, as newer versions often add new features and fix miscellaneous bugs.
- When launching CapFrameX with multiple processes that are currently using the GPU, you might get a “Multiple processes detected” message in the RTSS-powered overlay of CapFrameX. Should that happen to you, make sure to either close the offending game process or move it to CapFrameX’s Process ignore list altogether:

With CapFrameX installed and configured, you’re now ready to start benchmarking your favorite games!
How to Capture Benchmark Runs with CapFrameX
Capturing consistent benchmark runs is the core of meaningful performance analysis. CapFrameX doesn’t just grab a single FPS number; it records frametimes and lets you derive metrics like Average FPS, 1 % low average FPS, and 0.1 % low average FPS from them. This process requires you to start and stop captures properly, focus on consistent scenes, and manage your runs in a repeatable way.
Here’s how to do it step-by-step:
1. Launching CapFrameX and your game
- Open CapFrameX and make sure it’s running in the background (it should be in the system tray of the Windows taskbar when you minimize its window).
- Start your game and load into the scene you want to benchmark. Pick a location where it’s very easy to do repeatable runs. It’s critical that you choose a segment you can reproduce run after run to make your results comparable.
- If your CapFrameX setup is working properly, then you should see the CapFrameX overlay (as configured in the Overlay tab of the application) if you have RTSS installed and its overlay also enabled:


2. Start the capture
To begin recording:
- In CapFrameX’s Capture tab, double-check your capture hotkey (by default, it’s F11 or an alternate key combination you may have set).
- When your game is ready (right as the relevant scene starts), press your capture hotkey, then CapFrameX’s capture engine will log raw frametimes and (if enabled) sensor data from that point forward. You will also hear a sound or voice cue (CAPTURE STARTED) if you’ve enabled it in the Capture tab. The CapFrameX (and RTSS) overlay(s) will also disappear when the capture starts, as this is the default behavior that can be changed in the OSD Options of the Overlay tab.
Tip: Set Capture Time [s] = 0 in the Capture tab for unlimited manual control. This means that CapFrameX will keep recording until you press the hotkey again, rather than stopping automatically after a fixed duration. This gives you more flexibility for making highly customized or extended benchmark runs.
During capture, the game will continue to run normally. Go through the exact sequence you chose for your benchmark (same route, same fight, same camera angle, etc.).
3. Stop the capture
Once you’ve completed the benchmark segment:
- In case you’ve set the capture time to a value that’s greater than 0, then the capture will automatically stop after that set capture time. If the capture time is set to 0, then the capture will continue until you manually stop it by hitting the capture hotkey again. For making easily repeatable runs, I strongly recommend setting a reasonable capture duration (at least 20 seconds), then making use of CapFrameX’s run history feature to capture multiple runs of the same benchmark. If you have the sound/voice cue enabled, then you’ll hear either a sound or (CAPTURE FINISHED) once your capture has been processed by CapFrameX.
- In the CapFrameX UI, you’ll see the completed capture appear in the Captures section on the left. Each run you do gets its own entry.


4. Do multiple benchmark runs
For the most reliable results, it’s best practice to capture multiple runs of the same scene, ideally at least 3. This helps curb run-tun-run variance and gives cleaner statistics when you use CapFrameX’s run history and aggregation features.
Repeat the same benchmarking process for each run, while making sure that:
- You start at the same point in the game each time.
- The scene, camera angle, and movement are consistent.
- You use the same graphics settings and system state for every run.

Analyzing Your Benchmarks in CapFrameX
Once you’ve captured benchmark runs with CapFrameX, the real value comes from interpreting the data, as in understanding how your game is performing, not just what numbers it produces. CapFrameX gives you two powerful views to do this: the Analysis tab for individual captures and the Comparison tab for side-by-side evaluation of multiple runs.
The Analysis tab
The Analysis tab is where you scrutinize one benchmark run at a time. It gives you a mix of graphs and statistics that help you understand the performance profile of that run in detail.

Key components of the Analysis view
- Frametime graphs:
These show the time (in milliseconds) it takes for each individual frame to be rendered. Smoother gameplay corresponds to flatter, more consistent frametime lines, while spikes reveal micro-stutters or bottlenecks. You can switch between raw values or filtered trendlines to help visualize consistency. - FPS graphs:
CapFrameX converts every frametime into an FPS (framerate) value, then plots these FPS over time. You can either view the raw FPS or a time-based average filter for a clearer representation of performance trends throughout the benchmark. - Percentile and metric summary:
Below the graphs, you’ll see metrics such as average FPS and low-percentile FPS values (like 1% and 0.1 % low average FPS). These percentiles are calculated directly from all measured frametimes, giving you a more meaningful picture of consistency than simple snapshot values. - Pie & FPS threshold charts:
CapFrameX visualizes the amount of time spent in stuttered ranges, for example, for the frametimes that are far above the average or below the FPS thresholds, thus helping you quickly gauge how often performance dips below smooth play. - Sensor data (optional):
If you’ve enabled sensor logging during your captures, CapFrameX can show CPU/GPU temps, loads, clocks, and power values alongside your performance graphs. This is invaluable for diagnosing bottlenecks. For example, a CPU that’s pegged while GPU usage is low indicates a CPU/RAM limitation.
You can also switch between different methods on how to display the captured raw frametime data, either in the form of frametimes (or also display times which actually relate to the timing of the frames being displayed on your monitor screen), FPS figures, a so-called “L-shape” distribution graph and a more conventional bell curve looking statistical frametime distribution of the aforementioned data.
The Comparison tab
While the Analysis tab focuses on one run, the Comparison tab lets you evaluate multiple benchmark captures together, which is very convenient when you want to compare different game graphics settings, hardware setups, driver versions, or other variables that can influence benchmark results.

Using the Comparison tab in CapFrameX is straightforward and very useful for visualizing differences between multiple benchmark runs. To start, simply drag and drop any captures from the Captures list on the left into the Comparisons list on the right. Once they’re added, you’ll see those captures displayed in the main part of the tab, in the default Bar charts view. CapFrameX then gives you flexible options for presenting your data: you can choose the type of chart or graph you want to view (such as bar charts for metrics or frametime/FPS overlays), select which performance metrics (average FPS, 1% low average FPS, 0.1% low average FPS) are shown, and even set a custom title for your comparison chart to help communicate what you’re showing. On top of that, you can sort and group captures however you like, for example, by game title or by performance metric, which then makes it easy to organize and interpret results when comparing different game graphics settings, hardware specs, or miscellaneous software configurations. With a little experimentation, this tab becomes a powerful way to draw clear, visual conclusions from your benchmarking data.

Benchlab is a hardware-based telemetry and monitoring platform used by hardware reviewers, overclockers, and enthusiasts to measure how a PC behaves electrically and thermally in real time. Unlike software-only tools, Benchlab is a physical device that connects directly to the system’s power and sensors, allowing it to capture high-accuracy data such as power draw, voltage levels, temperatures, fan speeds, and ambient conditions. For hardware reviews, this enables reviewers to see exactly how much power a CPU or GPU consumes, how stable voltages are under load, and how cooling behaves during benchmarks, all with consistent and repeatable measurements that are more reliable than motherboard-reported sensors.
CapFrameX can interface with the Benchlab hardware via the “PMD” tab, which stands for “Power Measurement Device, as it allows for logging and graphing the more accurate hardware-based sensor telemetry, which can then be used to properly analyze accurate system power consumption and thus power efficiency metrics during your gaming sessions.


Common Benchmarking Pitfalls and How to Avoid Them
Even with a powerful benchmarking tool like CapFrameX, it’s surprisingly easy to get misleading results if you don’t set up and run your benchmarks the right way. These are some of the most common mistakes that people can make, alongside practical advice for avoiding them so your results are accurate, consistent, and meaningful.
Running benchmarks with inconsistent scenes
One of the biggest mistakes people make is capturing data from different or non-repeatable gameplay segments. Framerates/frametimes can vary dramatically between scenes in the same game, as in an open world game, for example, traversal, combat, cutscenes, and menus all stress hardware in different ways.
As such, it’s critical to pick the same scene to benchmark in a repeatable way.
Ignoring frametime variance
Many beginners only look at average FPS without considering how consistent the frametimes are. High average FPS with wildly varying frametimes will still feel choppy during gameplay. A stable experience with higher 1% and 0.1% lows will typically feel much better than a slightly higher average with large frametime lurches. Which is why it’s very important to consider all three performance metrics when analyzing your benchmark captures.
Not preparing your system properly.
Background apps, overlays, or OS services can skew benchmarking results, even on high-end rigs. As such, it’s very important to run your benchmarks with the bare minimum of necessary apps, services, and overlays open in order to minimize interference. Enabling Windows options like Game Mode and Hardware-Accelerated GPU Scheduling can also further help stabilize your benchmark results, but your mileage may vary.
Skipping multiple runs
Running only one capture for a scene is rarely representative, as momentary, inevitable background tasks or random spikes can heavily skew a single result. That is why making use of CapFrameX’s run history and aggregation features is simply a must if you want your captures to be as accurate and as representative of your gaming experience as possible.
Accidentally comparing different game or system settings.
Another frequent slip-up is comparing benchmark results taken at different graphics settings, operating system builds, and driver versions. Which is why it is paramount to make sure that your benchmarks have all been made using the same graphics settings, operating system build, and drivers in order to minimize the amount of variables as much as possible. This is, of course, unless you’re attempting to benchmark the potential performance impact of an OS or driver update!
Overlooking system limits and bottlenecks
Sometimes poor benchmark numbers aren’t due to the GPU at all. A CPU bottleneck, memory bottleneck, or even storage streaming issues can show up as inconsistent frametimes. Which is why it’s very important to know exactly which hardware part(s) you’re actually benchmarking. If you’re benchmarking your GPU, then make sure that you’re as GPU-bound as possible throughout the benchmark duration by maximizing graphics settings and especially the rendering resolution. The same thing applies to your CPU/RAM combo, for example, as in that case, you may want to lower the rendering resolution as much as possible while still maxing out graphics settings, as that will give these parts the highest possible workout.
Forgetting to warm up the game
Benchmarking straight into a fresh game launch can capture unusual spikes from shader compilation, asset streaming, or even (slightly) artificially boost your benchmark results by having your cold CPU/GPU run at higher clock speeds due to how modern frequency boosting algorithms scale with temperature. As such, it’s important to perform some “warm-up runs” in case you want benchmark results that are truly representative of long-term gameplay.
Not enabling “MsBetweenDisplayChange” when benchmarking with Frame Generation enabled
By default, CapFrameX measures raw frame-to-frame render times (also called presents in graphics rendering nomenclature) by calculating the time intervals between a game application’s present calls to the GPU. This method is called “MsBetweenPresents” and is accurate for basically every game/engine out there that’s using a relatively modern graphics API. However, when benchmarking your game with Frame Generation technologies (such as NVIDIA DLSS Frame Generation/Multi-Frame Generation, AMD FSR Frame Generation, or Intel Xe Frame Generation) enabled, you will certainly want to enable the alternative “MsBetweenDisplayChange” method in the CapFrameX options:

Final Words
Benchmarking isn’t just about how high your FPS number goes; it’s about understanding how consistently and smoothly your PC delivers those frames in real gameplay scenarios. While average FPS gives a general sense of raw speed, it doesn’t capture frame pacing, stutters, hitches, or the experience of dips that can break your immersion even when the headline number looks good. That’s why tools like CapFrameX, with support for per-frame time capture and percentile-based metrics like 1 % low average FPS and 0.1 % low average FPS, are essential for anyone serious about performance analysis; these metrics reveal how a game feels, not just how fast it runs. Lower variation in frametimes and higher low-percentile framerates strongly correlate with smoother, more enjoyable gameplay, while poor metrics here can signal underlying problems even if average FPS appears respectable.
By carefully preparing your system, running consistent benchmark passes, and interpreting CapFrameX’s detailed outputs, including frametime charts and percentile FPS values, you equip yourself to make smarter hardware decisions, tune settings for better real-world performance, and communicate results in a way that’s meaningful to both enthusiasts and everyday gamers. Moreover, this methodology holds value beyond enthusiast testing, as developers and reviewers alike rely on similar metrics to optimize experiences, identify bottlenecks, and ensure that games feel as good as they look.
In the end, benchmarking with CapFrameX empowers you to go beyond surface-level framerate numbers and truly understand the performance profile of your system, which is a crucial step for anyone who wants performance data that’s repeatable, accurate, and genuinely useful for evaluating real gaming performance.


And last but not least, I want to give huge thanks to the developers of CapFrameX, who have provided me with tremendous help while writing this guide by providing proper explanations of their program’s various features, tips on how to make the best of it, and actively contributing to the guide’s content itself.
Follow Wccftech on Google to get more of our news coverage in your feeds.
Agen Togel Terpercaya
Bandar Togel
Sabung Ayam Online
Berita Terkini
Artikel Terbaru
Berita Terbaru
Penerbangan
Berita Politik
Berita Politik
Software
Software Download
Download Aplikasi
Berita Terkini
News
Jasa PBN
Jasa Artikel
News
Breaking News
Berita
Related Posts

Petunjuk dan jawaban Rintangan hari ini untuk 26 Desember 2025

Kate Hudson Memecah Keheningan Saat Menolak Peran Mary Jane di Spider-Man: “Rasanya Tidak Menyenangkan”